A loadcell is like a very stiff spring, an applied load causes a very small deflection. A nominal direct strain of 1000 x 10-6 is used to detect full load on a simple column loadcell. The typical deflection for a 10kN F207 loadcell at full rated load is 9µm, or 9 microns.
The relationship between force, stiffness and deflection is:
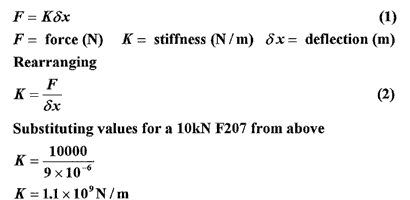
The stiffness values for all of our loadcells can be found on the data sheets.
Foil strain gauges are limited to a strain bandwidth , but variations in stiffness values occur due to the different design of loadcell types. It is easy to imagine how a F250 diaphragm loadcell can be ‘softer’ than an F207 loadwasher type.
For most systems where the mass is vibrating at a high frequency the combined effect of the mass and the loadcell stiffness can result in a phase shift between the input force and loadcell output. Note mass is the key factor; a high frequency force input to a loadcell of little interactive mass is different to a heavy petrol engine at full throttle sitting on loadcell mounts.
Ignoring small amounts of damping, the natural frequency of a mass spring system is given by:

The highest natural frequency a loadcell will oscillate at if struck lightly is sometimes called the ringing frequency. The mass involved in this case is the interactive mass of the loadcell itself. The ringing frequency or the natural frequency, which is dependant upon mass, are not practical ways of giving the key information required for engineers to fully analyse the mass system which could be complex.
Consider a rotating wheel with an imbalance in the form of a mass concentration mounted on an F307 loadcell which has good axial sensitivity and high EFI.
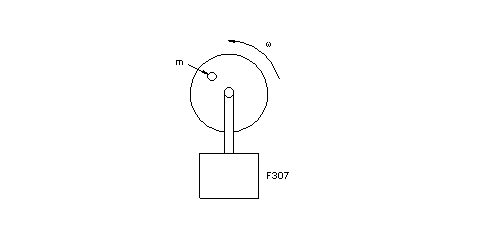
The theoretical force seen by the F307 loadcell is:
![]()
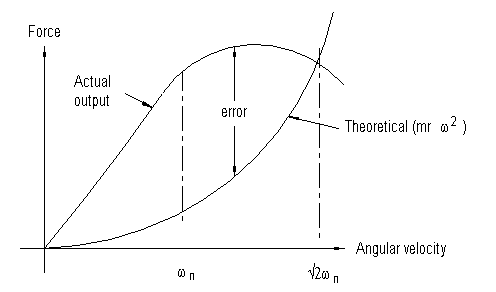
The maximum error will occur at the natural frequency of the mass system, but note the output is only exactly correct at two points 0Hz and
![]()
The higher the mass system natural frequency the lower the error will be at low frequencies. If we assume that we are using a 20kN F307 in the Z axis, the mass system natural frequency can be calculated using (3):
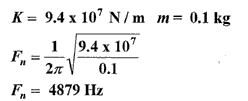
From the second order differential equations describing the simple harmonic nature of the imbalance mass in the Z axis it can be shown that a good rule of thumb for error evaluation is:
|
Force input frequencies up to one tenth of the mass systems natural frequency yield measurement errors of less than 1%. |
For our example, the F307 can be to used up to 487 Hz if we can accept a maximum 1% measurement error at this frequency.
If 487 Hz is too low, a higher load rating F307 will provide a higher stiffness value thereby increasing the mass system natural frequency. If we use a 40kN F307 in the Z axis, the mass system natural frequency can be calculated using (3):
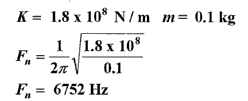
A higher usuable frequency of 675 Hz is now available but at the cost of a reduced output signal magnitude, which may affect signal resolution.
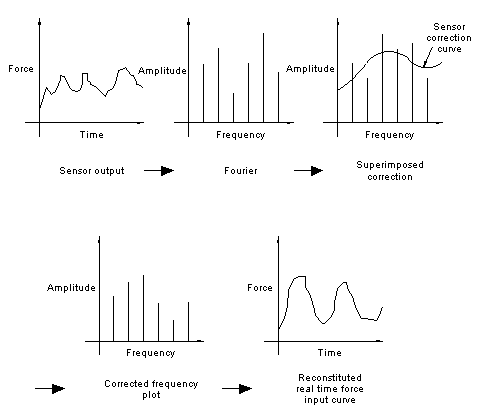
For more complex dynamic input forms the time domain input wave form can be represented by a series of varying magnitude and frequency sine waves, a technique called Fourier analysis. The complex time domain input is therefore represented by a frequency domain plot whereby each frequency magnitude can be corrected using the same maths that resulted in our rule of thumb. The frequency plot can then be reconstituted to form a real time domain plot showing the actual force input. A spectrum analyser is capable of the conversion in real time.
Many display instruments have in-built signal filters that can remove high frequency inputs, thus reducing error by looking only at low frequency signals. Most real life vibration problems occur below 30 Hz.
